Build notes / Python APIs
What 30 Django requests told me about my API
Six requests took over 300 milliseconds. Three others failed almost immediately. I built PyPulse to see which endpoint was responsible for each number, then tried it on a small orders API.
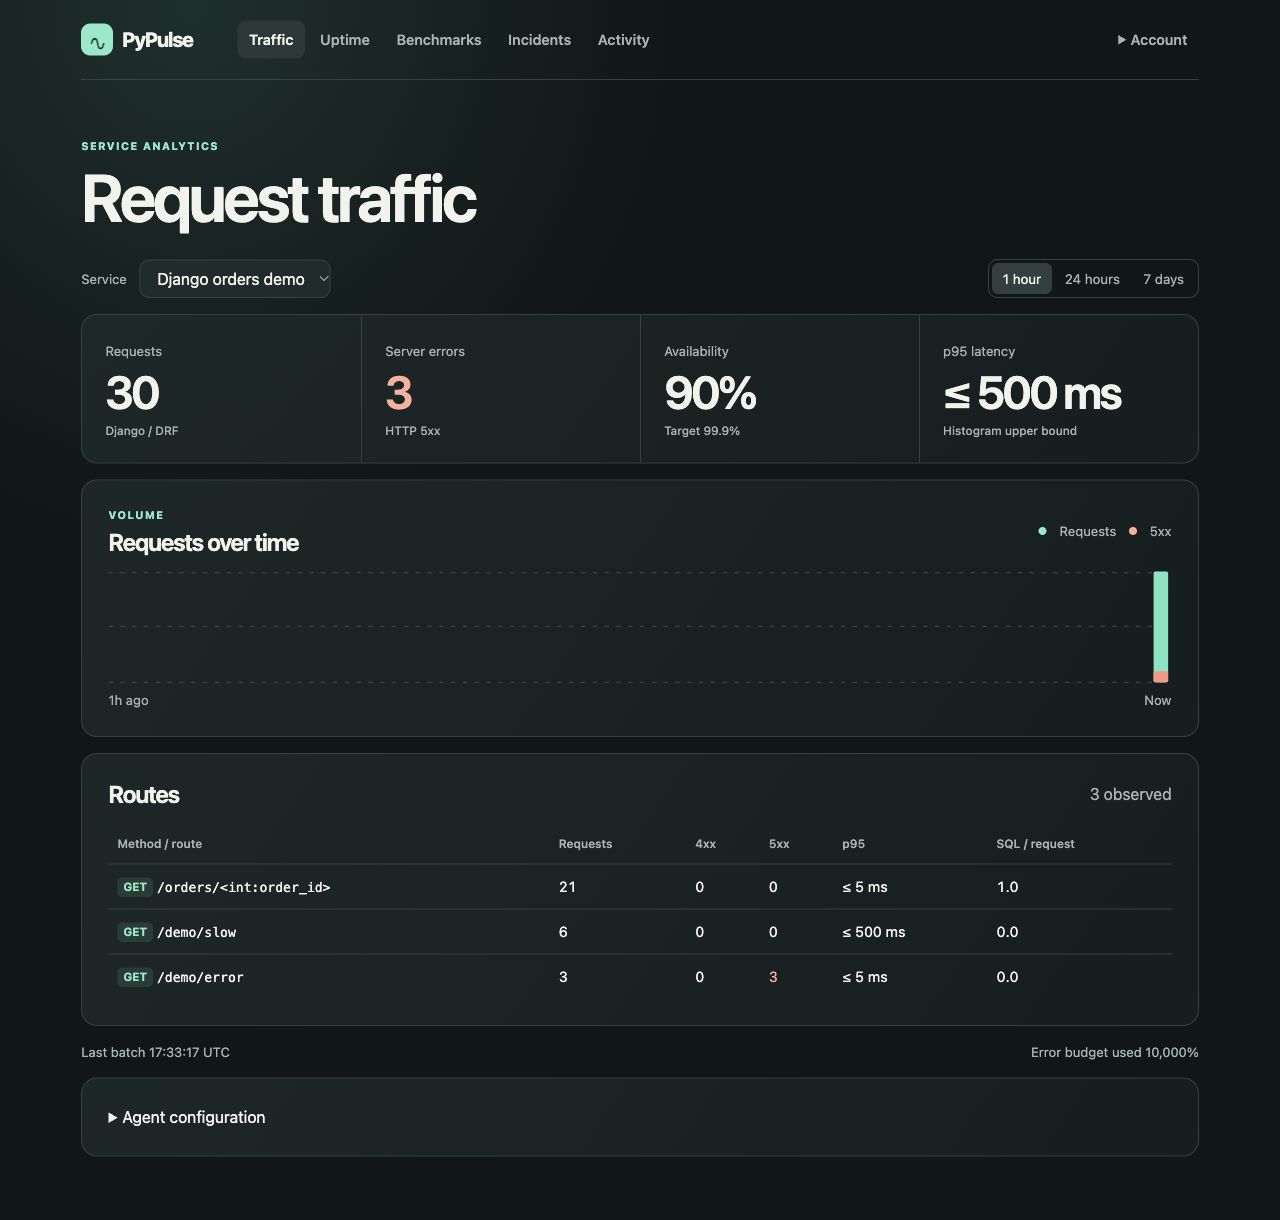
One availability number, three different routes
I sent 30 HTTP requests to a local Django REST Framework app. Twenty-one fetched an order, six called a view with a deliberate 320 ms delay, and three called a view that always returns HTTP 500. That gave me a known answer to check against the dashboard.
The service showed 90% availability. Opening the route table explained it. Every order lookup succeeded. So did all six slow calls. All three errors came from /demo/error, and those failures finished quickly. If I only had the availability number, I wouldn't know which view to open in my editor.
I added a 320 ms wait inside the slow view. The Python report displayed p95 ≤ 500 ms. The worker counts requests in latency buckets and sends those counts in batches. A 325 ms request lands in the bucket ending at 500 ms. The SQL column is another useful clue. If a change takes my order lookup from one query to twenty, I have somewhere specific to start reading code.
How the dashboard gets those numbers
I wrote the collector and dashboard in Django. A separate Python worker makes scheduled checks and runs benchmarks. A small adapter inside the monitored app measures incoming requests. The first dashboard I tried used a JavaScript server. I replaced that implementation and reran both experiments on the Python build shown here.
- Clone PyPulse, run
docker compose up -d --buildin the checkout and openhttp://localhost:8080. Create an admin withdocker compose exec web python manage.py createsuperuser, sign in, and choose Traffic → Connect service. - Install
./pythonfrom the checkout into your application’s Python environment. SetPYPULSE_URLto the collector address reachable by your workers andPYPULSE_TOKENto the token for that service. - For Django or DRF, put
pypulse_agent.django.middlewarefirst inMIDDLEWARE. FastAPI registersPulseMiddlewareon the app. Flask callsinstrument(app)during app creation. Restart the workers and send a request.
The report groups requests by route template. Looking up three different order IDs increments one row. The agent normally sends a batch every ten seconds, and the page refreshes every ten seconds. A new deployment can take about twenty seconds after its first request to appear. The adapter examples, environment variables and container networking notes are in the framework setup guide.
A second experiment with one endpoint
Next I opened Benchmarks and selected just GET /orders/42. I set a fixed target of 10 requests per second for 30 seconds. This time the generator recorded 300 responses, all HTTP 200. It dropped zero iterations. Client-side p95 was 8.62 ms and p99 was 25.65 ms.
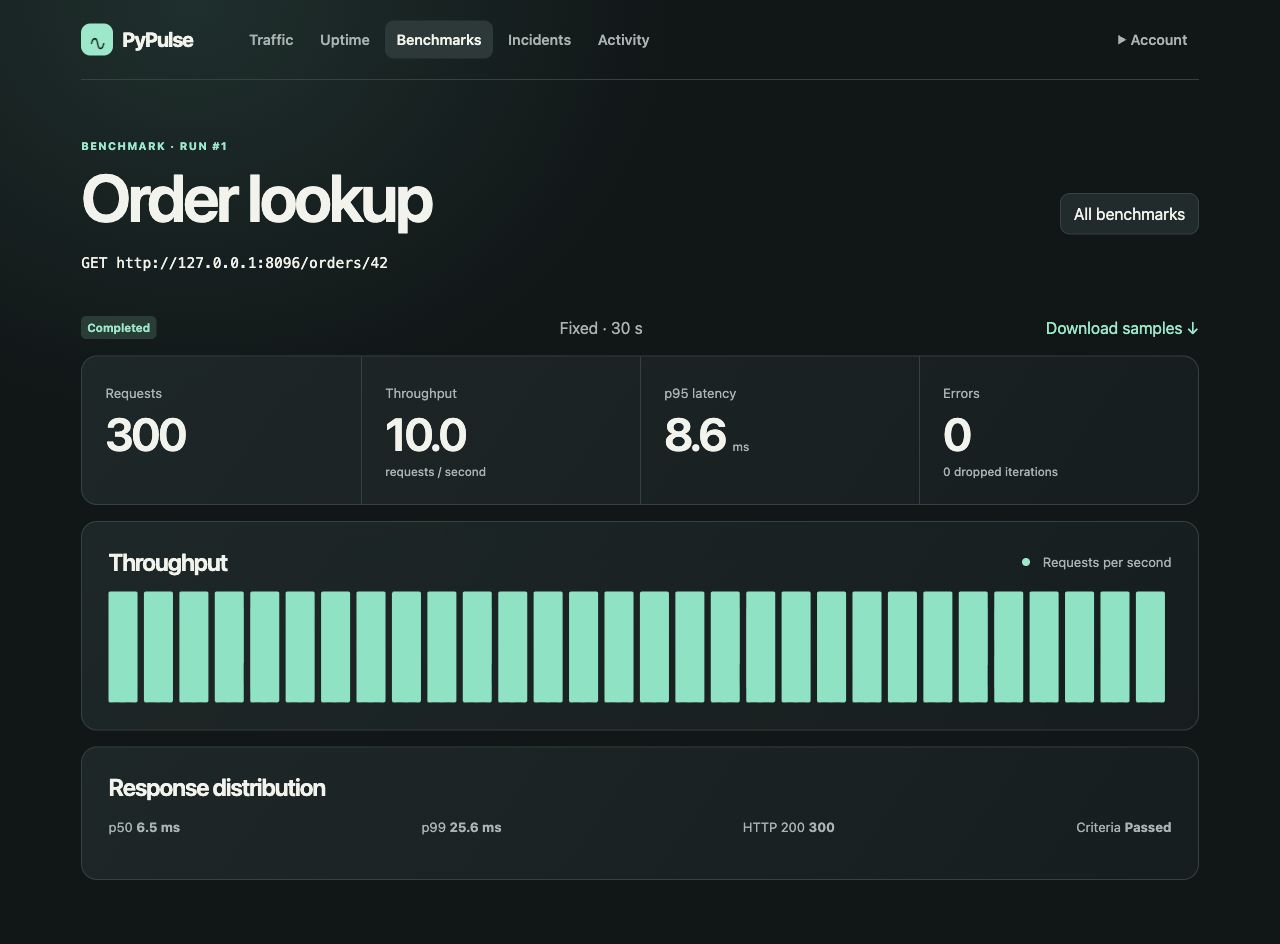
Those timings came from a Django development server on the same machine as the generator. I’d repeat the same saved test against a staging deployment with representative data and workers before using it to make a capacity decision.
Try one change and watch one row
With the included Django demo running, execute python examples/python/django_traffic.py from the checkout. Select your service and the 1 hour window. Once the 30 requests appear, visit /demo/error once more. Watch which row gains a request, which counter gains an error, and what happens to the service’s availability.
You can use that same setup to compare two releases, send a monitor alert or add a p95 pass criterion to a CI job. The repository includes the runnable examples, both screenshots and steps for each dashboard feature. Get PyPulse on GitHub · Dashboard feature guide.